
TChart
Simple and fast charts.
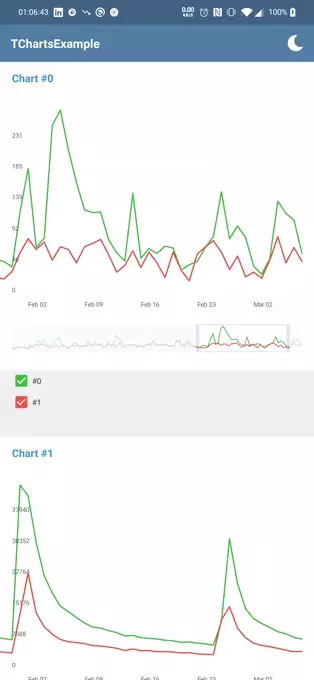
Preview
Import
jitpack.io
gradle
allprojects {
  repositories {
    ....
    maven { url 'https://jitpack.io' }
  }
}
dependencies {
implementation 'com.github.makstron:TCharts:0.9'
}maven
<repositories>
  <repository>
    <id>jitpack.io</id>
    <url>https://jitpack.io</url>
  </repository>
</repositories><dependency>
<groupId>com.github.makstron</groupId>
<artifactId>TCharts</artifactId>
<version>0.9.1</version>
</dependency>Usage
Sample project
See app directory. Sample project is under construction. Not all features are covered yet.
Usage in code
Example for create data
ArrayList<String> keys = new ArrayList<String>(); //keys for each chart
ArrayList<String> names = new ArrayList<String>(); //names for chart
ArrayList<Integer> colors = new ArrayList<Integer>(); //colors for lines
ArrayList<ChartItem> items = new ArrayList<ChartItem>(); //charts value for some time
//ChartItem
// time - time point (on x line)
// values - list values for this moment of time in order from keys

keys.add("y0");
keys.add("y1");
names.add("Red Line");
names.add("Green Line");
colors.add(Color.RED);
colors.add(Color.GREEN);

long startTime = 1614542230000L;
Random random = new Random();
for (int i = 0; i < 100; i++) {
  //time moment
  startTime += 86_400_000;

  //all values for this time moment
  ArrayList<Integer> values = new ArrayList<Integer>();
  for (int j = 0; j < keys.size(); j++) {
    values.add(random.nextInt(1000));
  }

  ChartItem chartItem = new ChartItem(startTime, values);
  items.add(chartItem);
}
ChartData chartData = new ChartData(keys, names, colors, items)
val tChart = TChart(context)
val layoutParams = LinearLayout.LayoutParams(ViewGroup.LayoutParams.MATCH_PARENT, ViewGroup.LayoutParams.WRAP_CONTENT)
tChart.layoutParams = layoutParams
tChart.id = View.generateViewId()
tChart.setData(chartData, true)
tChart.setTitle(String.format("Chart #%d", i))
layout.addView(tChart)Usage in XML
<com.klim.tcharts.TChart
  android:id="@+id/tchart"
  android:layout_width="match_parent"
  android:layout_height="300dp"
  android:layout_marginTop="8dp"
  android:padding="16dp"
  app:backgroundColor="#785630"
  app:detailDivisionColor="#fff"
  app:detailLabelsFontColor="#BA1B289E"
  app:detailLineSelectedPosition="#871893"
  app:infoWindowBackground="#6338C6"
  app:infoWindowShadowColor="#980A16"
  app:infoWindowTitleColor="#117F8E"
  app:navBordersColor="#000000"
  app:navViewFillColor="#BA7C3838"
  app:showTitle="true"
  app:title="Title"
  app:titleFontColor="#339728"
  app:titleFontSize="16dp" />
Properties
| Properties | Default White theme | Default Dark theme |
|---|---|---|
| backgroundColor | ||
| showTitle | true | true |
| title | ||
| titleFontSize | 16sp | 16sp |
| titleFontColor | ||
| detailLabelsFontColor | ||
| detailDivisionColor | ||
| detailLineSelectedPosition | ||
| infoWindowBackground | ||
| infoWindowShadowColor | ||
| infoWindowTitleColor | ||
| navViewFillColor | ||
| navBordersColor | ||
| navTapCircle |